Wraparound Blog
Nationwide Data Insights from WrapStat
June 14, 2023 | NWI
WrapStat data can show us how sites differ in terms of types of youth and families enrolled, length of enrollment, level of fidelity and satisfaction, rate of progress, and reasons for discharge. By putting all these data together, we can learn what factors might be associated with fidelity and outcomes.
We invite you to check out the accompanying infographic that summarizes what we learned. As you can see, there were some interesting findings:
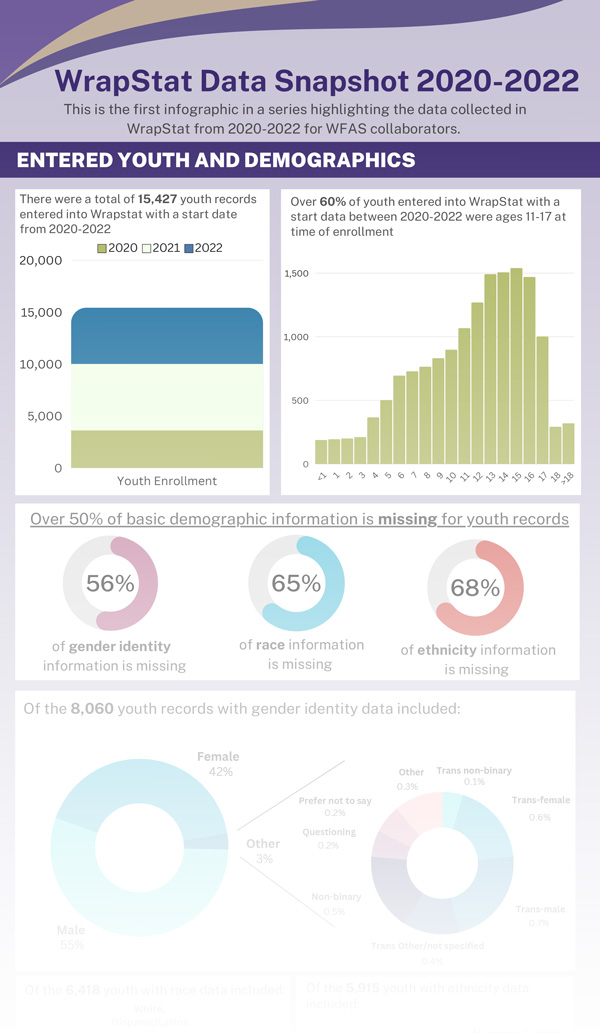
- WrapStat collaborators have been making new entries into their youth rosters steadily since WrapStat’s launch in 2020 – approximately 4,000 youth in 2020, 7,000 in 2021, and 5,000 in 2022.
- The median age of youth entered into WrapStat is 15. Over 60% of youth entered into WrapStat were ages 11-17 at time of enrollment.
- Of the 6,418 youth with race data included, 53% identify as White. Eighteen percent identify as Black, 12% Latinx, 7% Mixed race, 3% Native American/Alaska Native, and 1% Asian. Seven percent identify as belonging to another racial/ethnic group or preferred not to say.
- Critically important, WFAS collaborators are not consistently entering demographic data such as race into WrapStat. Two thirds of entries are missing race and ethnicity data and over half do not include the gender of the youth. Such a pattern compromises our ability to learn about whether, for example, racial differences in fidelity, satisfaction, or outcomes may exist in Wraparound systems of care.
- Similarly, only half of youth rostered in WrapStat have a discharge date, and of those, only 60% have a reason for discharge entered into the system. This means that, as of now, despite having nearly 19,000 youth entered into WrapStat, we only have discharge data for about 30%.
- On the positive side, our initial analysis illuminates just how much data we now have on domains such as caregiver- and youth-reported fidelity and satisfaction, and Wraparound team membership and processes. From 2020-2022, 9,715 WFI-EZ and TOM 2.0 forms were entered into WrapStat, with 2022 being the greatest year for data collection.
UW WERT and NWI will continue feeding data back to our national Wraparound community of practice. We will examine trends in Wraparound implementation nationally, and identify ways licensed users can contribute to the collective quest to use data to continually improve Wraparound – locally and globally.